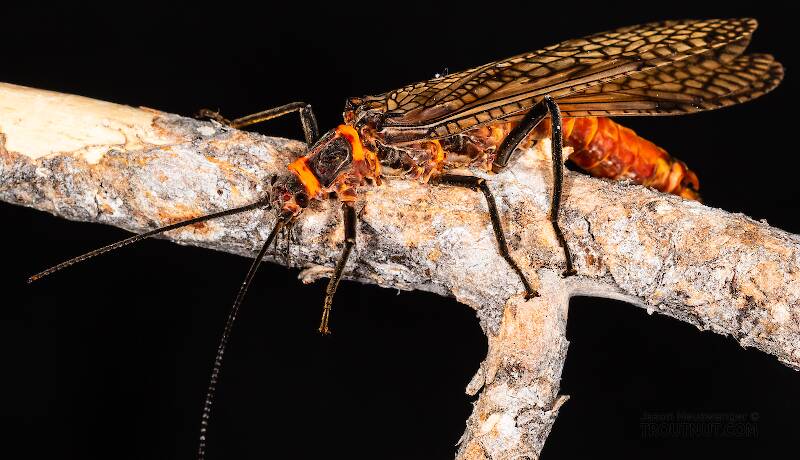
Salmonflies
Pteronarcys californica
The giant Salmonflies of the Western mountains are legendary for their proclivity to elicit consistent dry-fly action and ferocious strikes.

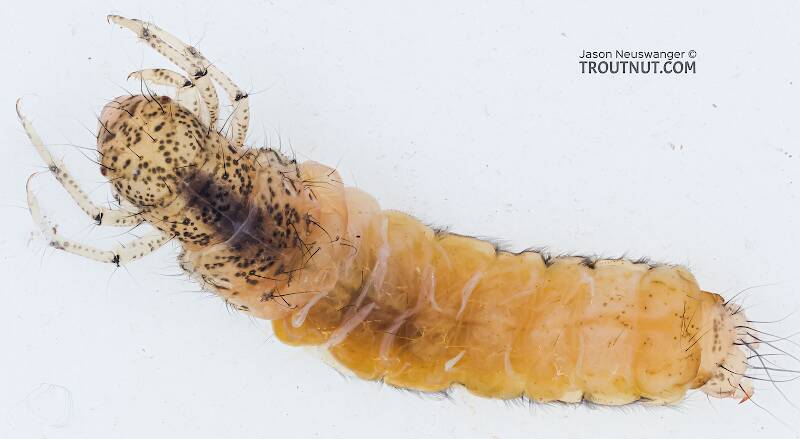
- The prosternal horn is present.
- The mandible is clearly toothed, not formed into a uniform scraper blade.
- The seems to be only 2 major setae on the ventral edge of the hind femur.
- Chloride epithelia seem to be absent from the dorsal side of any abdominal segments.
Based on these characteristics and the ones more easily visible from the pictures, this seems to be Grammotaulius. The key's description of the case is spot-on: "Case cylindrical, made of longitudinally arranged sedge or similar leaves," as is the description of the markings on the head, "Dorsum of head light brownish yellow with numerous discrete, small, dark spots." The spot pattern on the head is a very good match to figure 19.312 of Merritt R.W., Cummins, K.W., and Berg, M.B. (2019). The species ID is based on Grammotaulius betteni being the only species of this genus known in Washington state.

Custom Hatch Charts
Custom Hatch Charts
This tool is unlike any hatch chart you've ever seen: much better in some ways, worse in others.
Rather than providing the traditional graphics of emergence times, each chart work more like field guide to hatches for a specific time and place. You set the location (continental US/Canada) and time of year, and this hatch chart will show you many of the species you might encounter, with some of the most likely near the top. It shows many species normal hatch charts don't. It won't be as accurate about well-known hatches on specific rivers as a good local fly shop's hatch chart, but it can help with understanding obscure hatches or fishing destinations without local expert charts.
Generate custom hatch chart
Benefits of these hatch charts
When treated as a starting point and not the final word, these hatch charts are uniquely useful.
- They will show you many times more species than other hatch charts, including minor hatches that don't appear on most or any other charts.
- They can show you some specific species producing hatches in your area, whereas regular hatch charts often just use common names referring to multiple species. That's good enough for tying up the right pattern most of the time, but if you're interested in bugs for bugs' sake—or you want to look up a specific hatch to learn more about its emergence behavior or life cycle—then species names can matter.
- These hatch charts can help with tentative identification. For example, I have often identified an insect to genus after photographing it for this site. Lacking a good species key, I try to guess the species (or possible species) by looking at scientific distribution records for every species in the genus, cross-referencing those with my location, and further trying to find information on expected emergence times. It often takes 15–30 minutes. With this tool, it only takes a few seconds to find the likely possibilities.
Limitations
Because these charts are based on public and scientific records, they vary in reliability and offer only spotty coverage of a species' real distribution, especially for adults. Many if not most records are for nymphs and larvae.
- They sometimes exaggerate the importance of very common species (such as Hexagenia limbata), even in the wrong location or time of year, because there are some oddball public records in large samples.
- They still don't include all the species you might find, because many of the rarer species might not have produced any records in the source databases for the location and time of year you're searching.
- They aren't river-specific and don't incorporate things like local guide knowledge. The public records they're based on are too sparse to allow that level of detail. The calculations are state-wide, and sometimes the hatches in one part of a state with great climate variety (like California) can be very different from those in another part. Results also include insects collected from lakes and warmwater rivers, which can differ from trout streams in emergence timing and species composition.
How they work
These charts are created on-the-fly programmatically based on professional and amateur species occurrence records in public databases. They take into account the number of such records to hint at species abundance, the timing of adult collection records at similar latitudes, and the extent to which records for a species were recorded near the state or time-of-year of interest.

